
On Monday 19, the National Association of Homebuilders posted their housing Index for the month of October, disclosing fascinating results since the housing market continues to break records!
Since 1985, the seasonally adjusted index level for new construction has never been over 80, like it's the case for the months of September and October, being 85 this ending month.

New construction's high demand in the suburbs and small towns is due to COVID-19. Housing demand away from metro areas has definitely changed.
In the following chart, data above 50 indicates that developers perceive the industry as good, plus, the individual components of the index are at record levels.

Moving over to the single-family building, permits rose by 7.8 percent to an annual rate of 1.12M units which is another record. Similar results weren't seen since 2007. This means we expect more housing supply in the near future.

Alike building permits, single-family starts also have record numbers, increasing by 8.5 percent to an annual rate of 1.11M units the past month.

Lastly, results from existing homes sales across the U.S. are presented, one of the most important housing index. Sales in September increased 9.4 percent to a seasonally adjusted annual rate of 6.54M units.
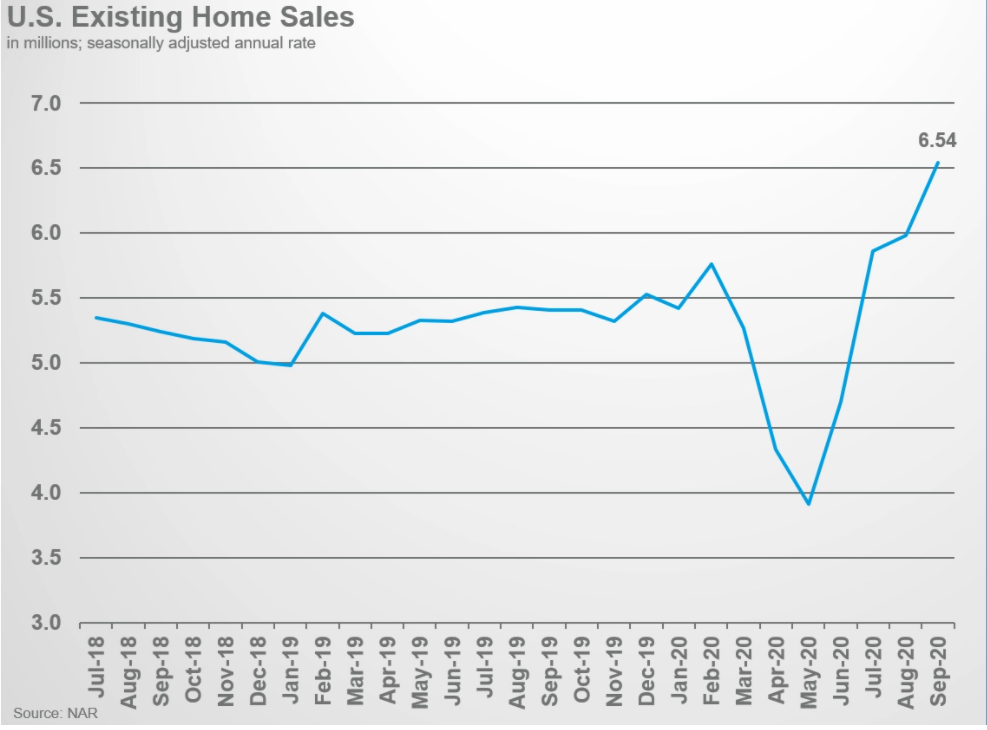
Even though the housing supply is at record levels, existing inventory has declined by 19.2 percent year over year to 1.47M units, this is an estimate of 2.7 months worth of supply, which is a record low since tracking began in 1982.
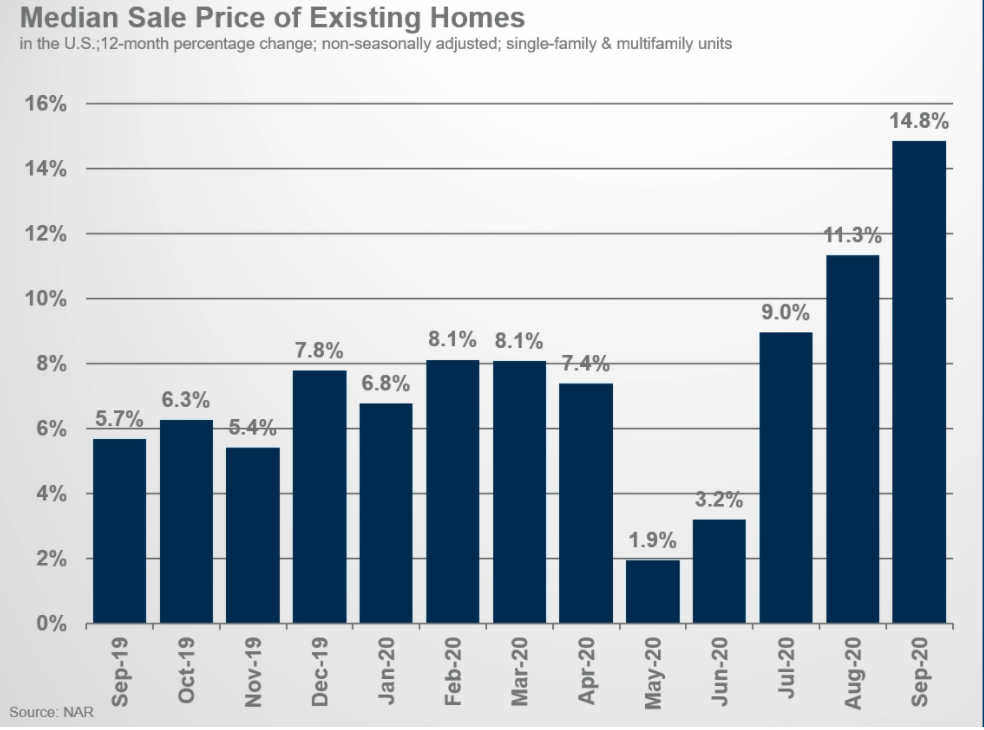
Low supply has been resulting in higher selling prices, the median sale price back in September was at $311,800, up by 14.8 percent compared to last year. This is another record, since 1968 when data started being analyzed and collected.
Remember to contact us at Castles Unlimited with all of your real estate needs!